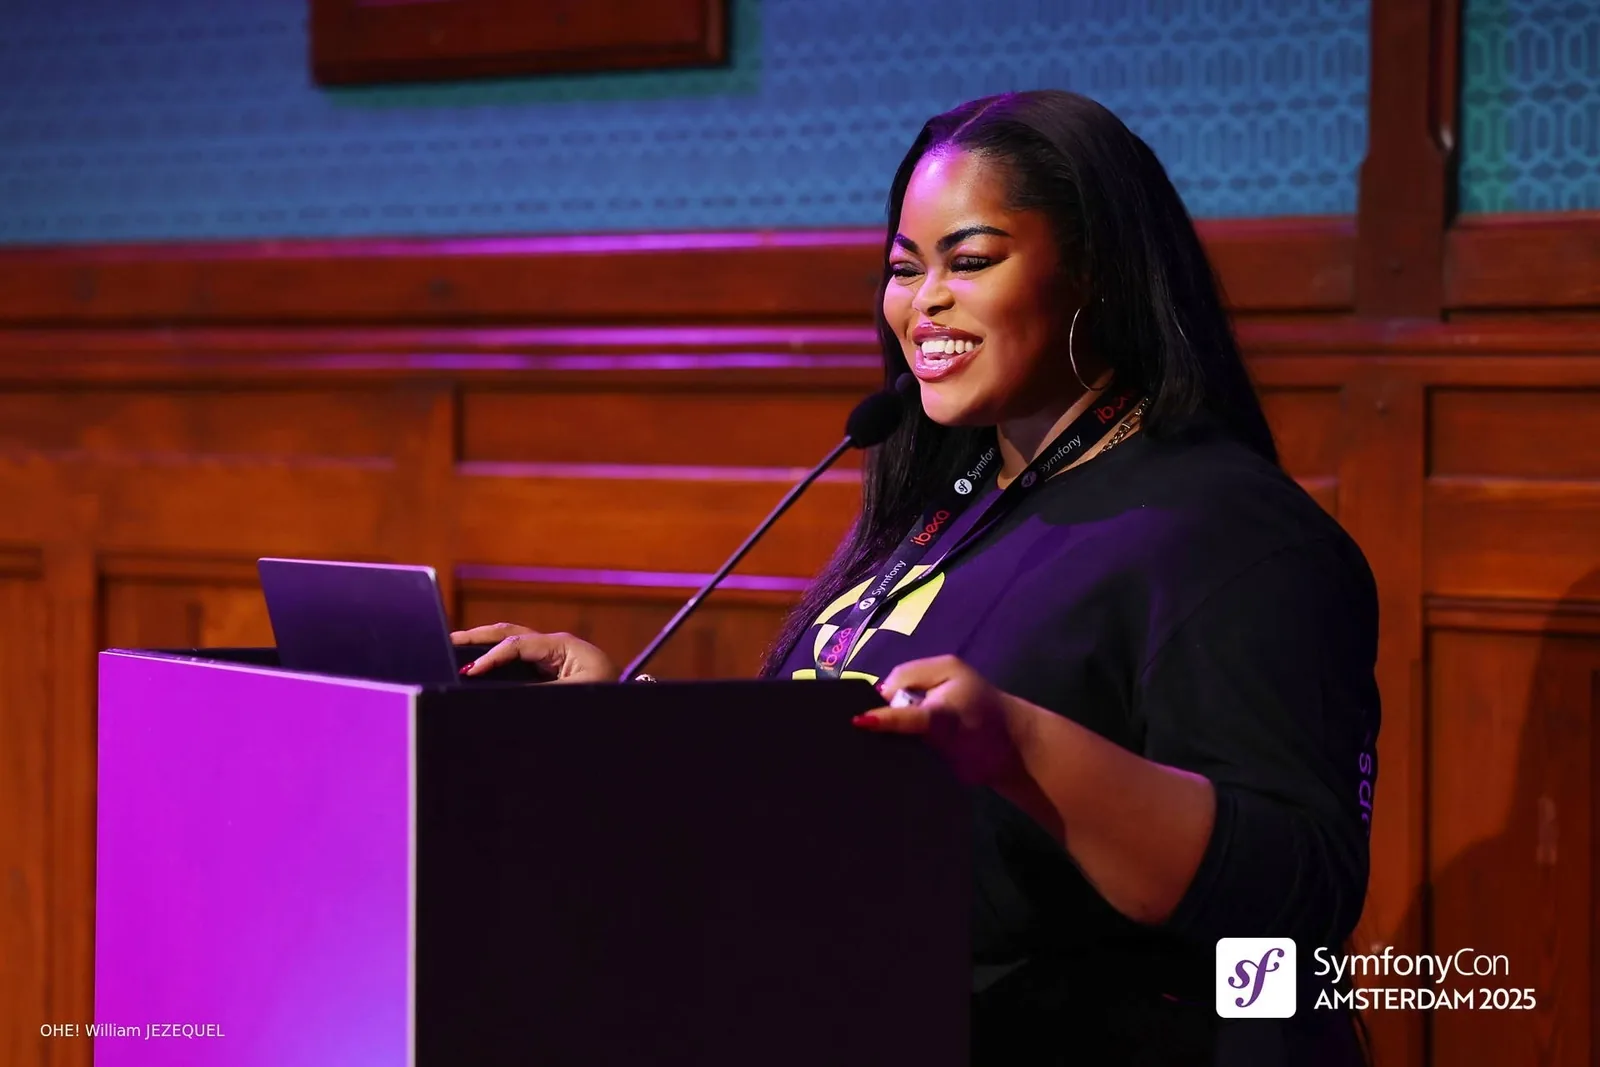
Developer education · Developer advocacy · Technical writing
Hi, I'm Kemi.
I write courses and documentation, give talks, make videos, and build tools with AI. I'm currently on the GraphAcademy team at Neo4j, but before that, I was doing developer documentation and advocacy, data visualisation engineering, content marketing and data journalism. I have two Master's degrees: one in Data Science and another in Contemporary Literature.
More about me
I design in Figma and Photoshop and edit video in Final Cut Pro, DaVinci Resolve and Premiere Pro. I'll build anything I find interesting, but I like it most when other people find it interesting too, especially when it's riding a trend. Mostly, I like teaching people things.
What I work with
Learning and curriculum
Curriculum design for data, analytics and AI. Course authoring in Markdown and MDX, docs-as-code, API reference, style guides, information architecture. Peer review and quality checks on technical learning content. Docusaurus, Hugo, Mintlify.
Data and analytics
Python (pandas, Flask, FastAPI), SQL, Snowflake, Tableau, Looker and Looker Studio, Metabase, Excel and Google Sheets, d3.js, Cypher and Neo4j.
AI
Generative AI and LLM pipelines, RAG, MCP, LangChain, prompt engineering. Claude, ChatGPT, Gemini and Microsoft Copilot. AI-assisted coding with Claude Code, Cursor and GitHub Copilot. AI ethics and responsible AI.
Engineering
JavaScript, React and TypeScript, Playwright, Git and GitHub, Postman, Vercel and GitHub Pages.
Design and video
Figma, Canva, Photoshop, Final Cut Pro, DaVinci Resolve, Premiere Pro, Screen Studio.
Ways of working
Agile and iterative delivery with Jira and Linear, cross-team documentation planning, Google Analytics and search analytics.
Speaking and video
Speaking and video.
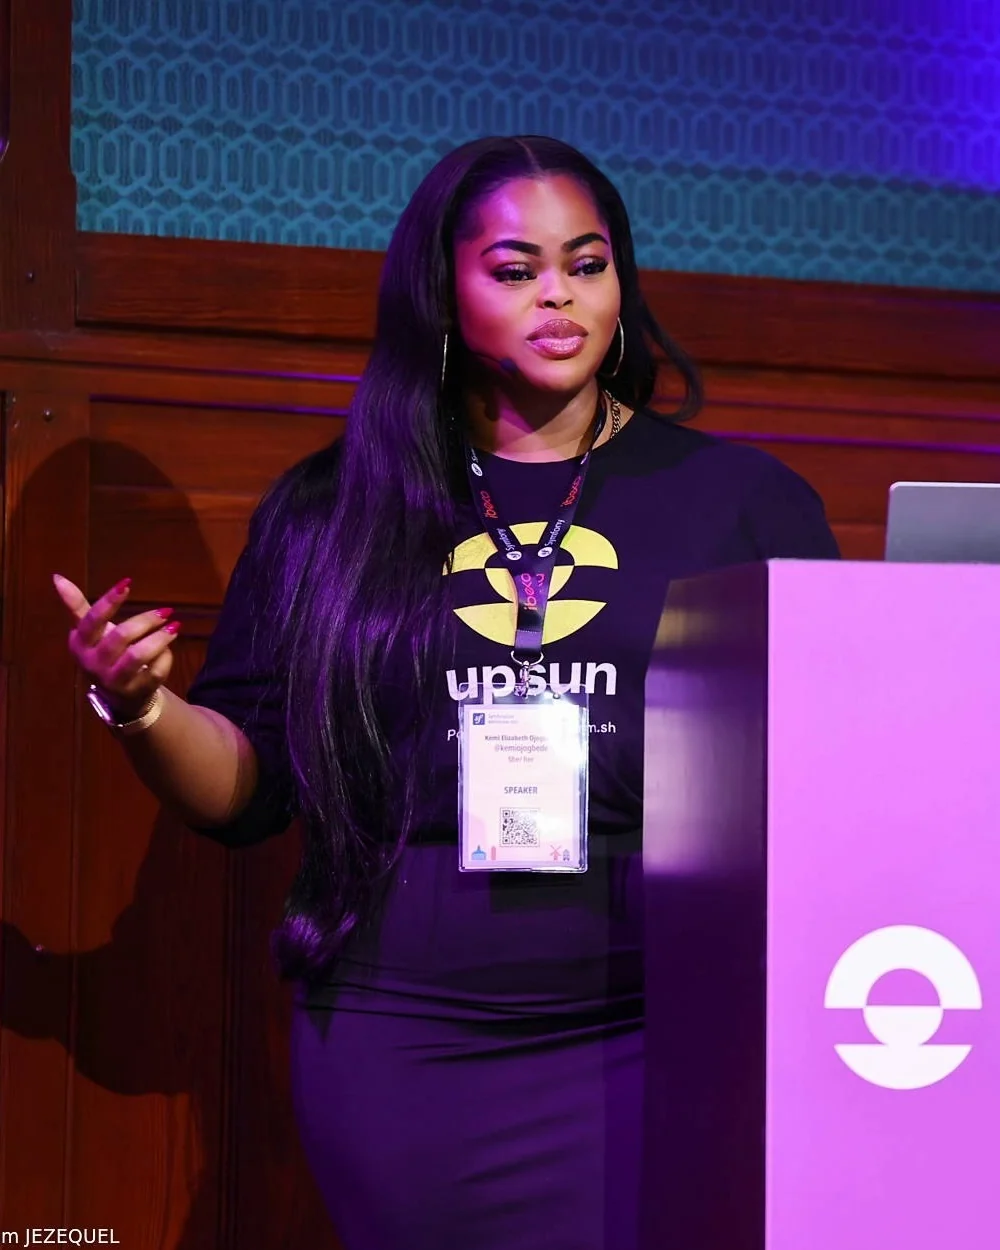
Conference sessions, community meetups and short-form videos.
The role of empathy in technical writing
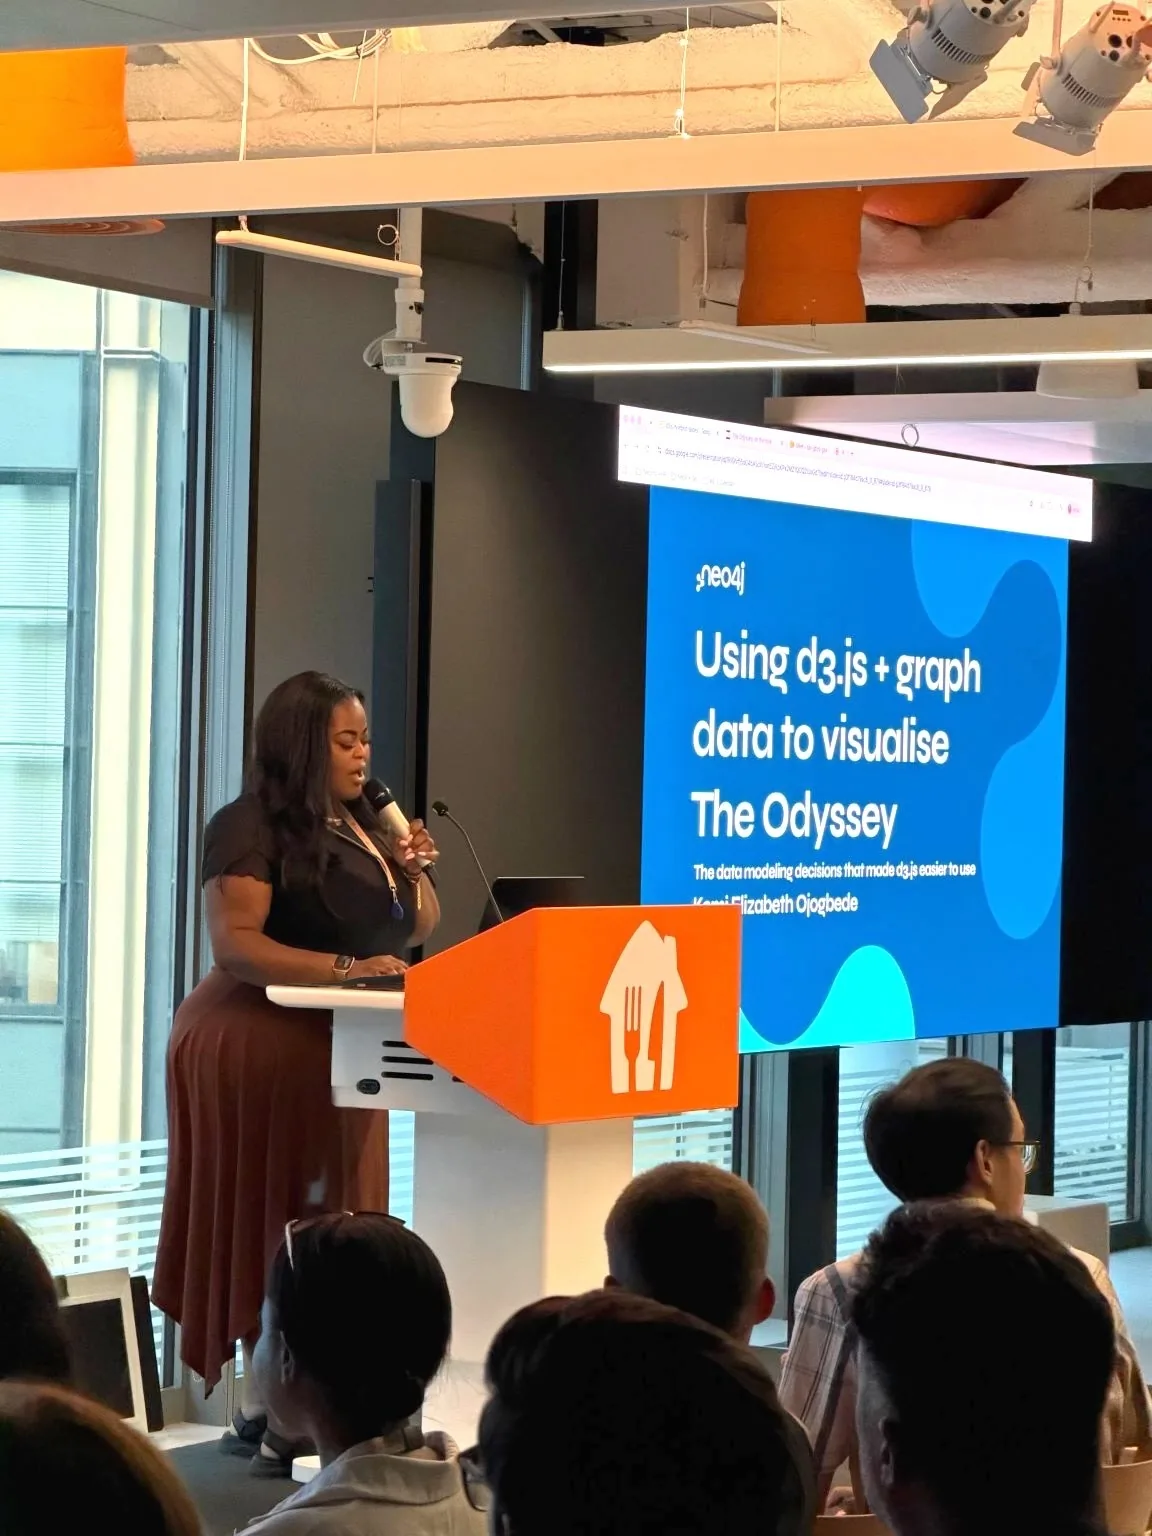
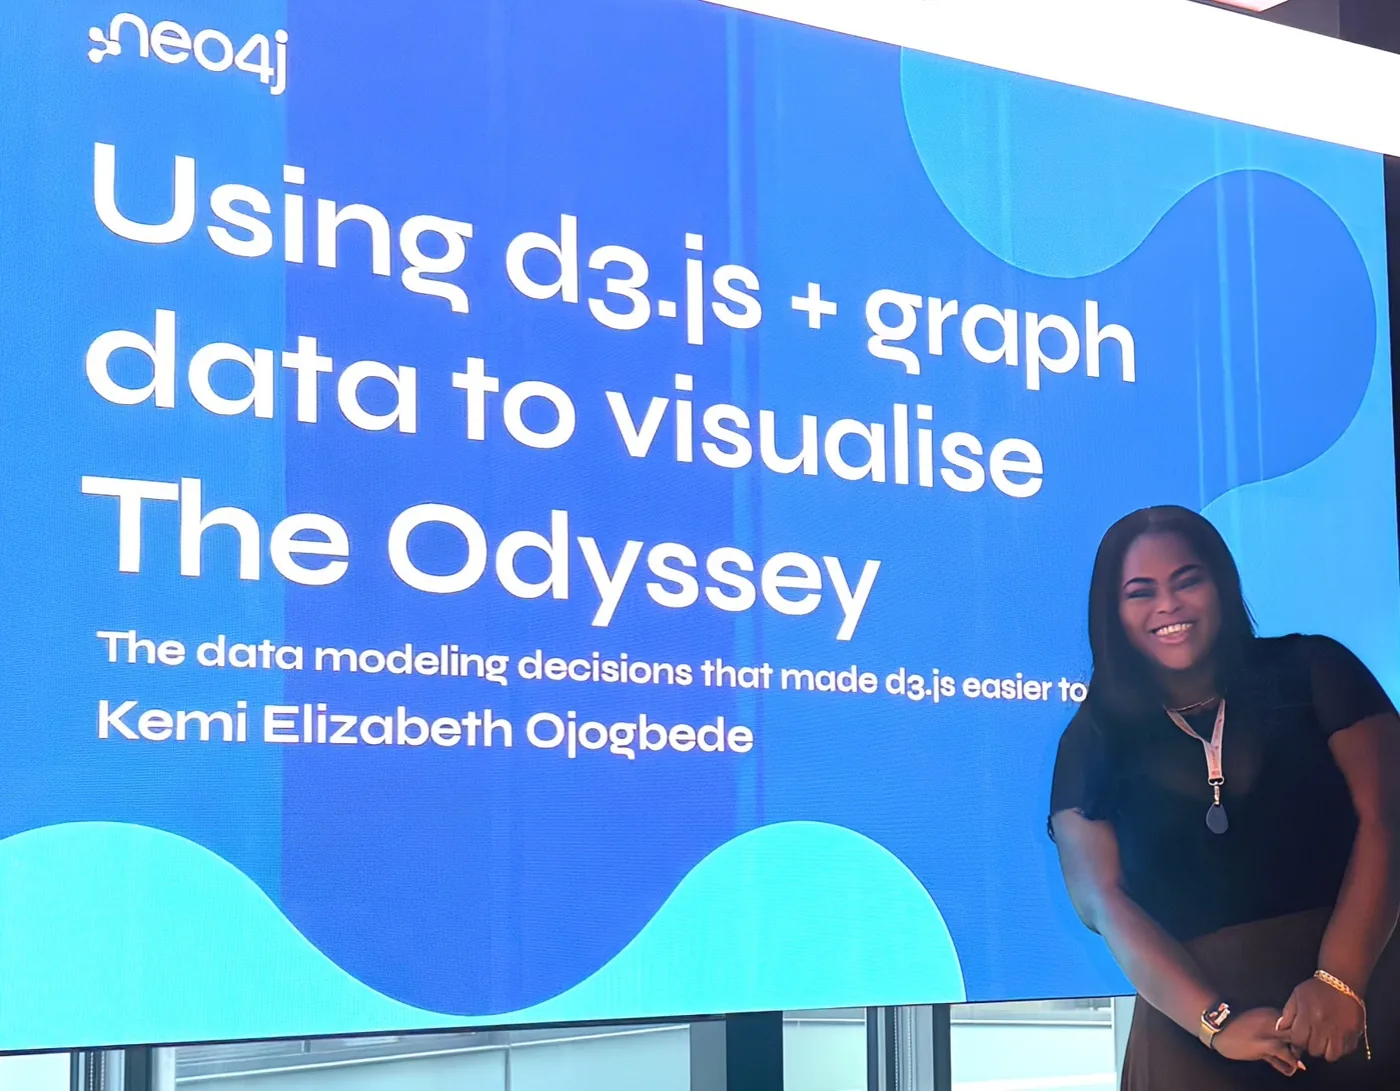
Using d3.js + graph data to visualise The Odyssey
On camera: why I chose this layout
Two-minute walkthrough
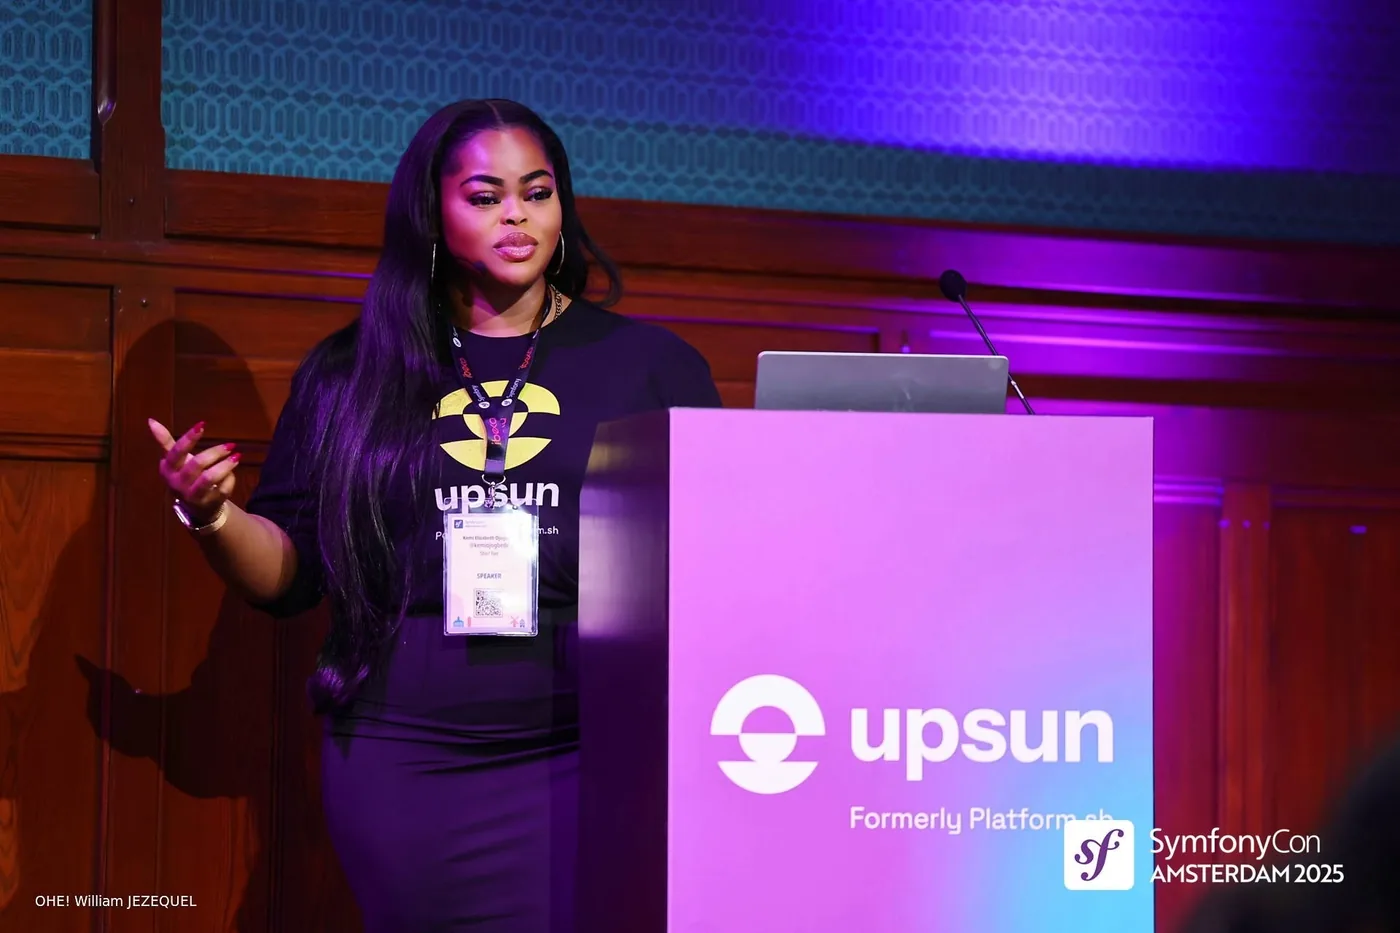
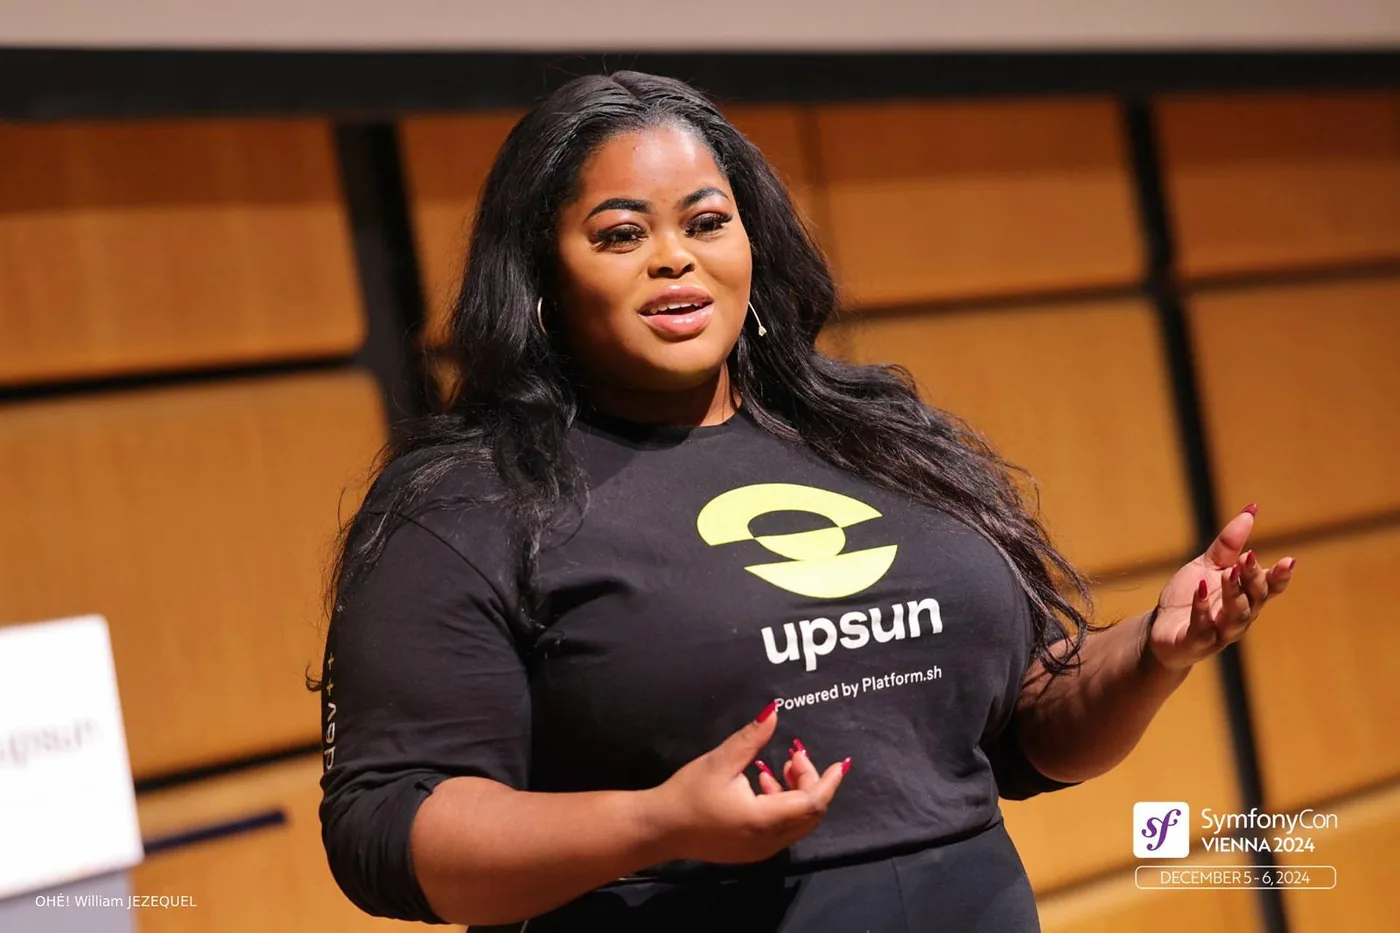
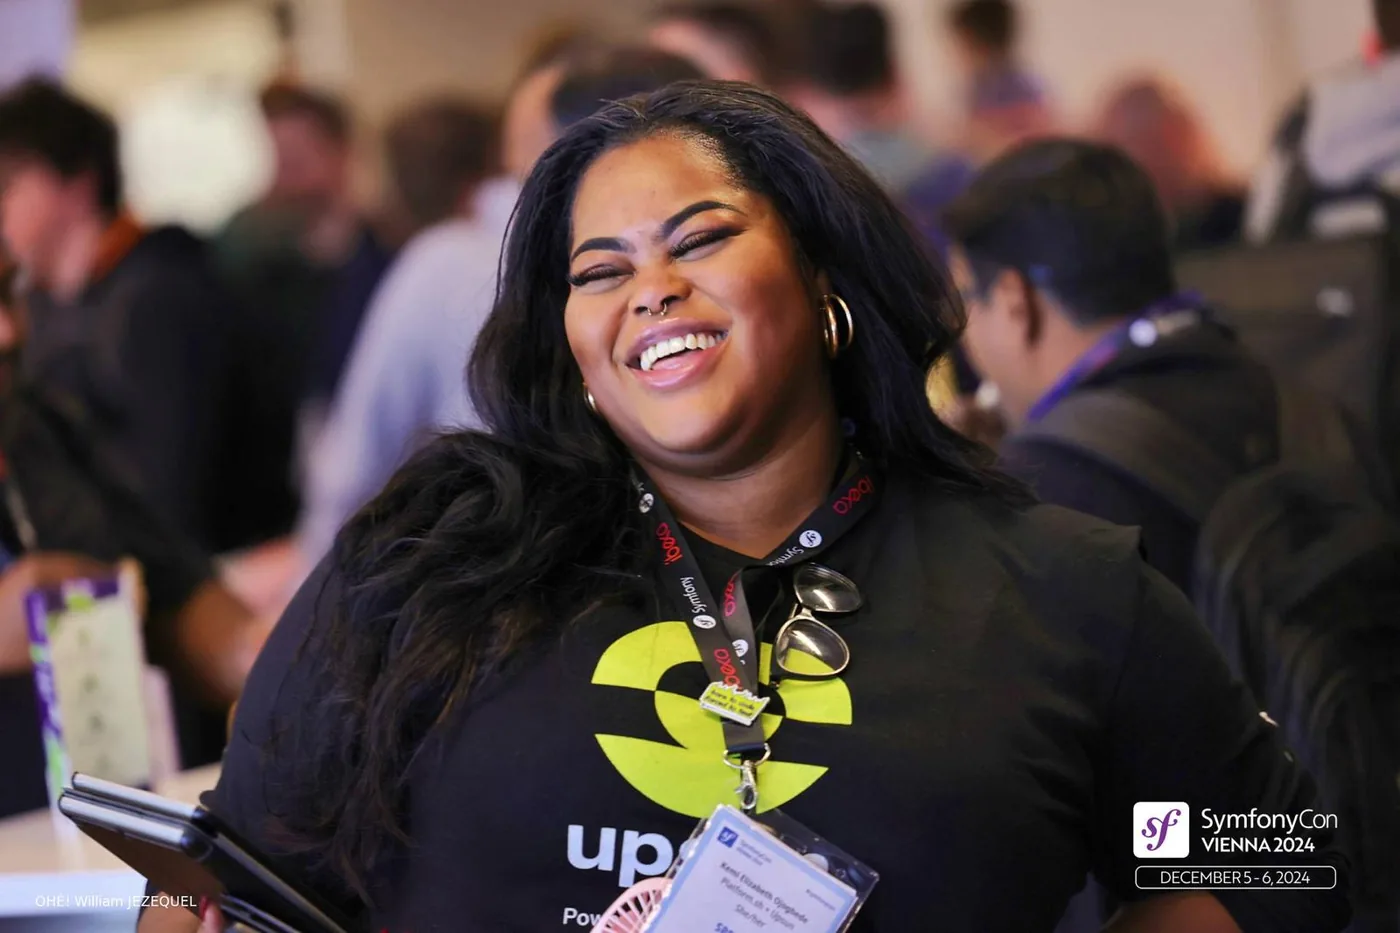
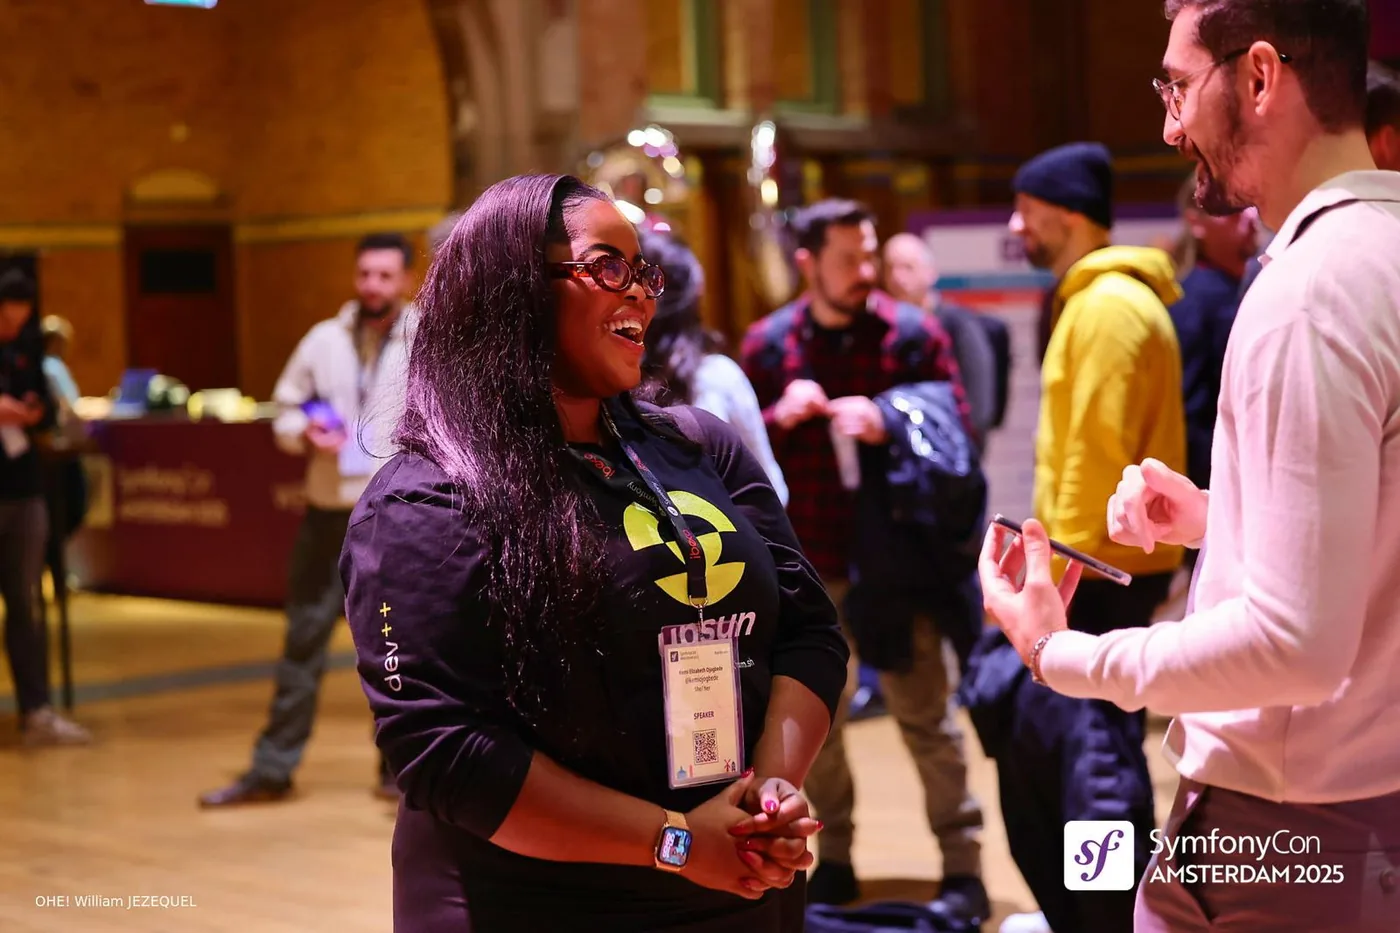
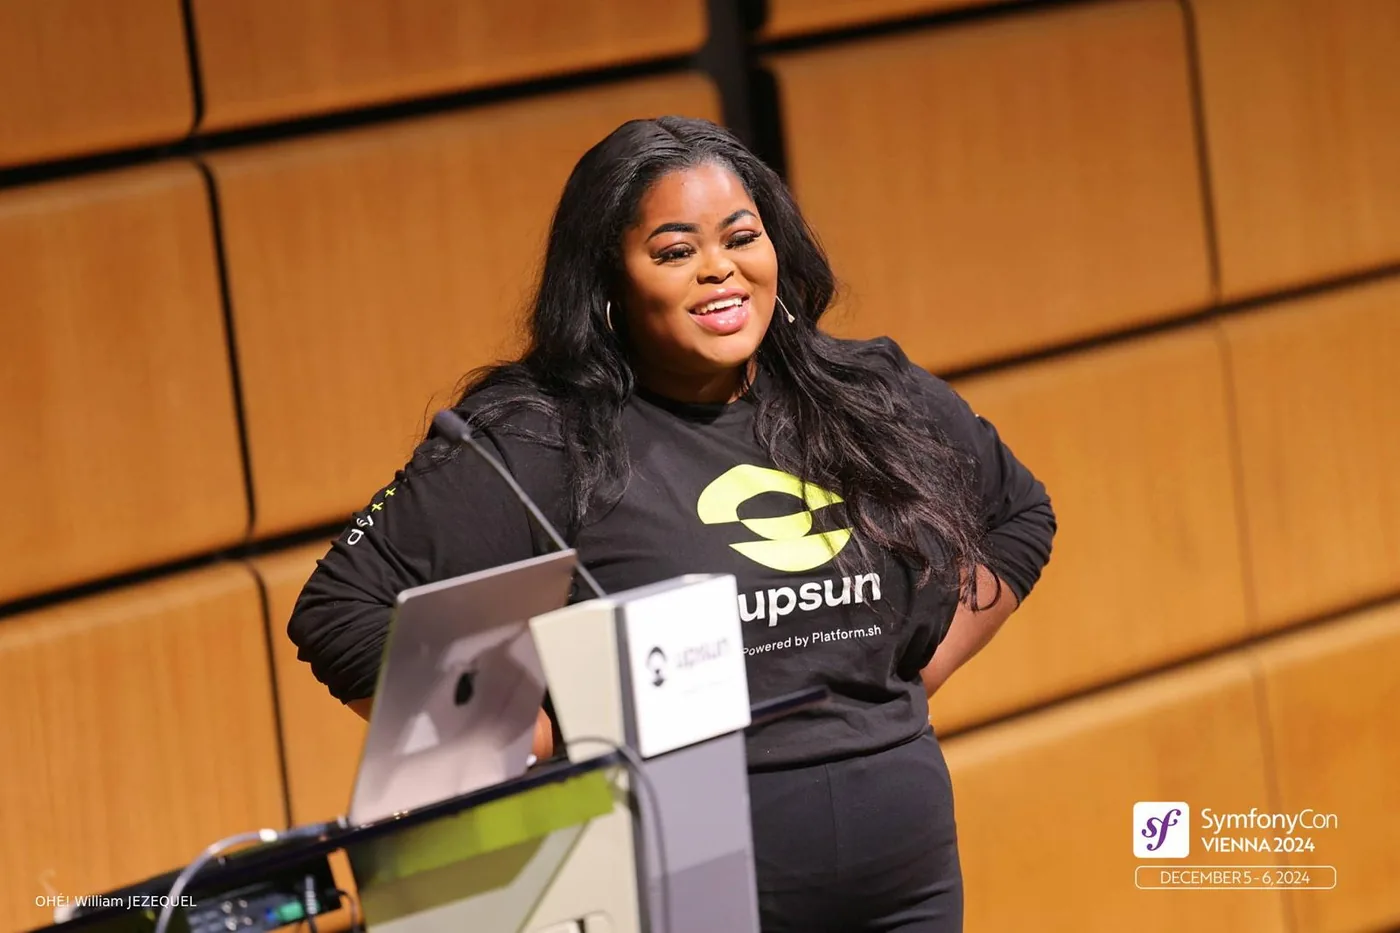
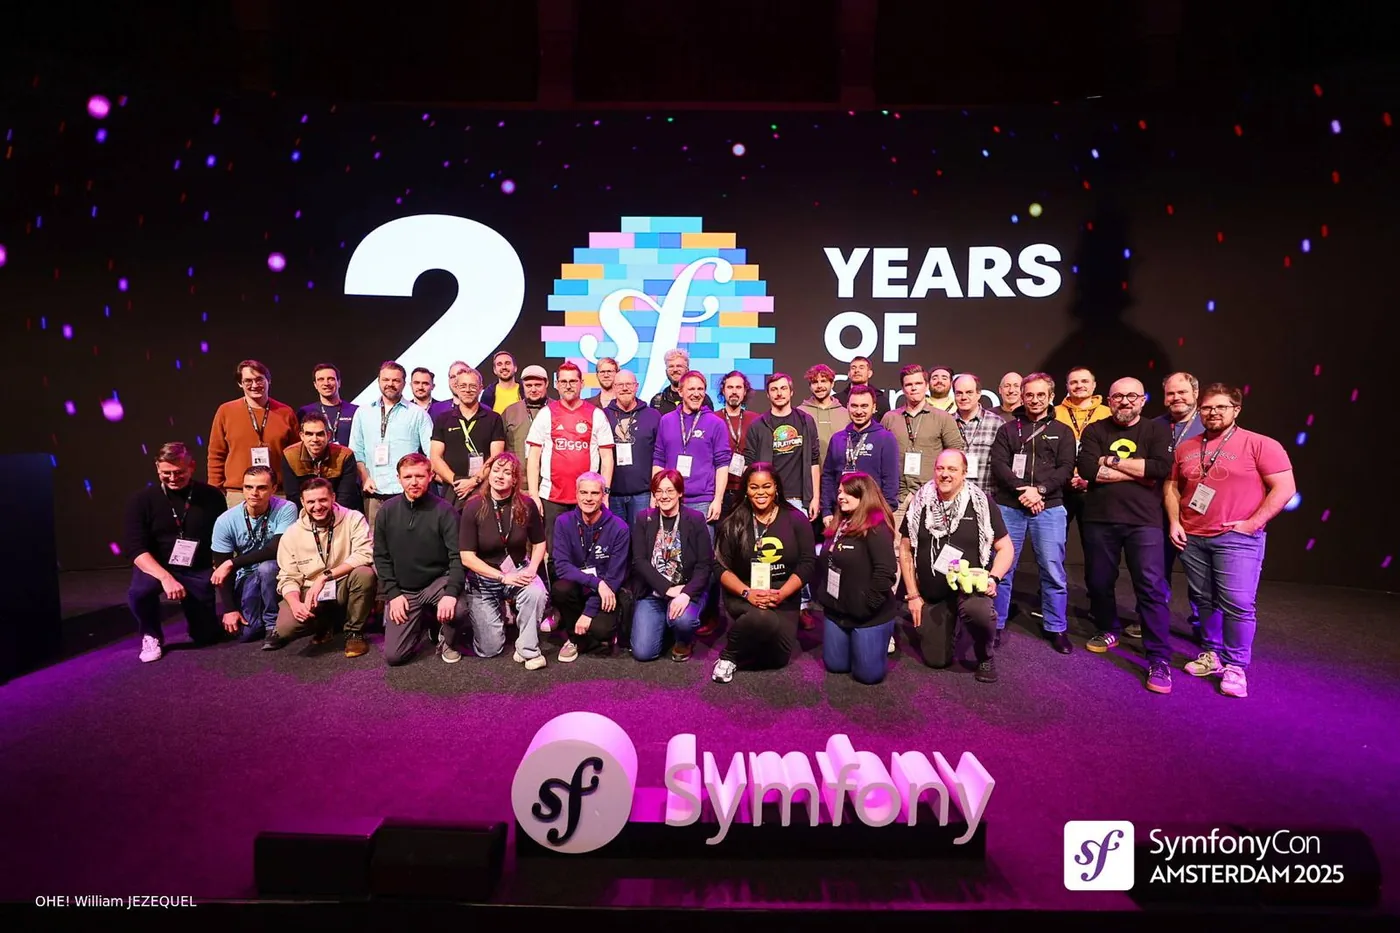
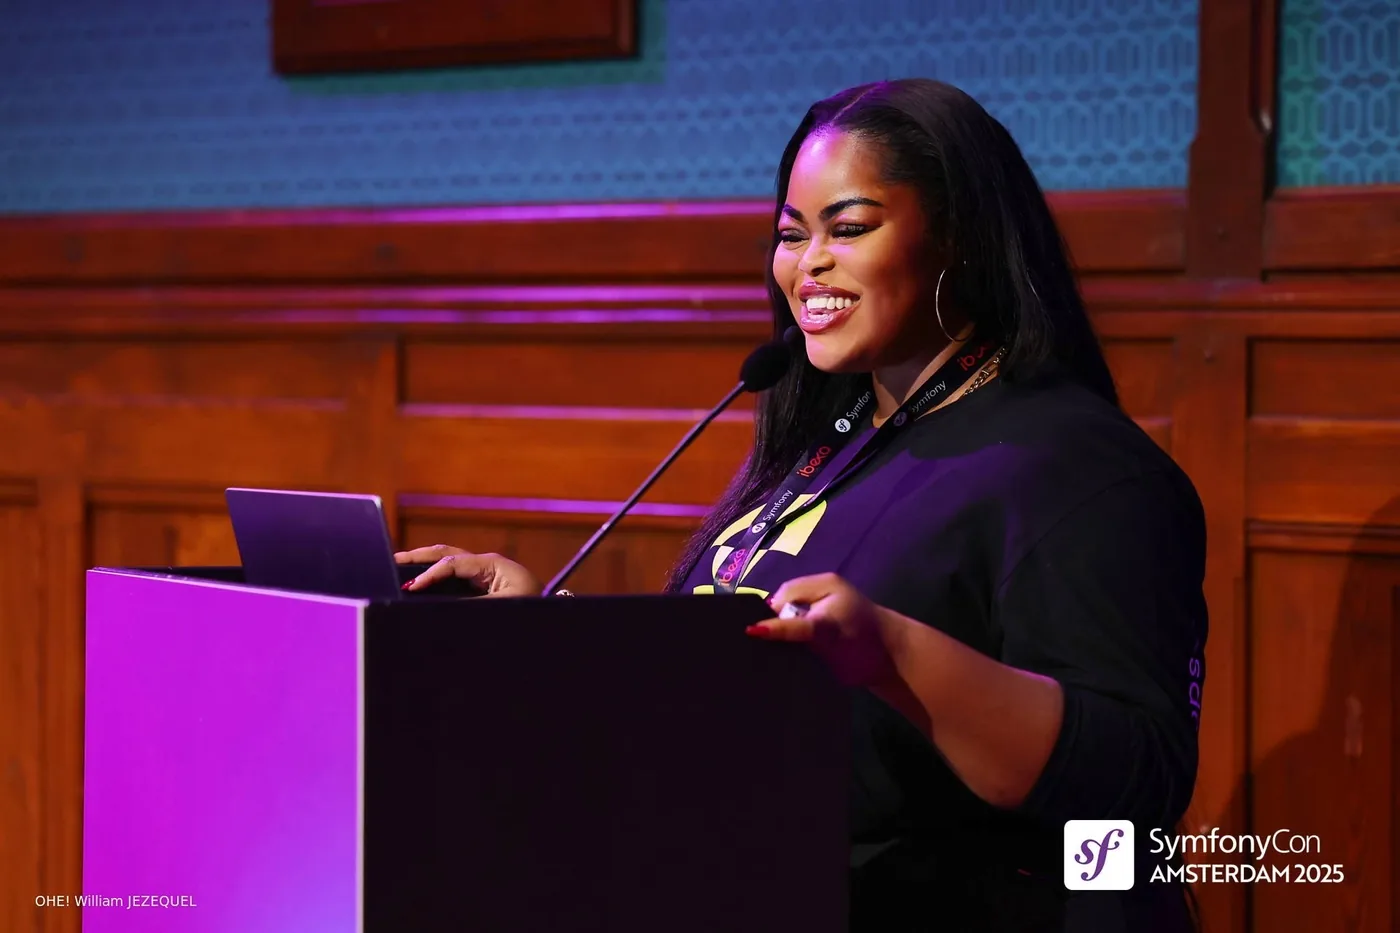
On stage and in the room
Conference photos. Scroll for more.
Selected work
Projects.
Things I've built, some for work and some because I was just curious.
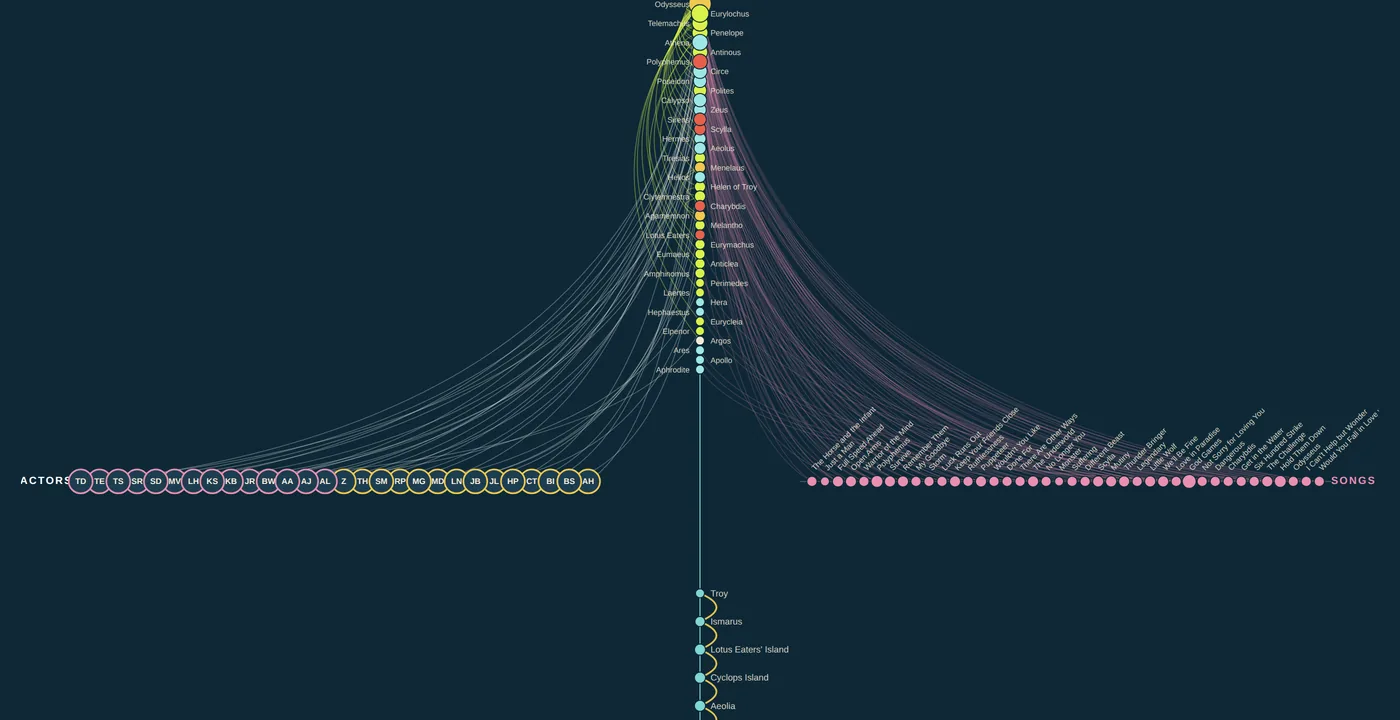
The Odyssey, three ways
What. An interactive visualisation of The Odyssey across three tellings: Homer's poem, EPIC: The Musical and Christopher Nolan's 2026 film. Hover anything for the story behind it; switch on previews and the songs play.
How and why
How. I built the dataset by hand (130 nodes, 235 relationships), loaded it into Neo4j, then drew it with d3.js as a hive plot: each type of thing gets its own axis, so the connections stay readable instead of collapsing into a hairball.
Why. The film was coming out, the musical was everywhere, and I wanted to know whether the three versions tell the same story. They don't quite. Building it also exposed a missing connection a spreadsheet had hidden, which became a piece for Nightingale.
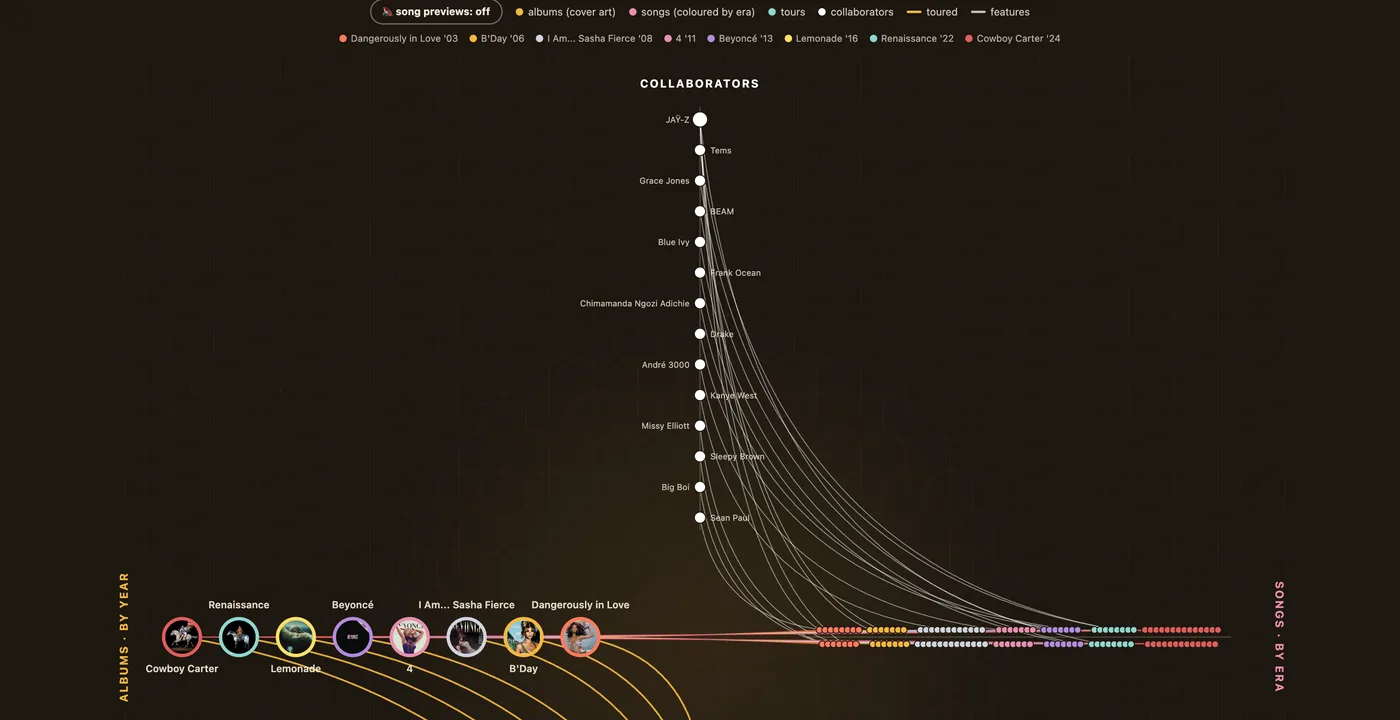
The BeyHive Plot
What. Beyoncé's solo discography as one interactive picture: eight albums as their own cover art, 100+ songs coloured by era, all seven tours, and every collaborator with a live Wikipedia bio. Hover a song and it plays.
How and why
How. I didn't use a database for this one. The structure (albums, tours, era facts) is hand-curated in the file. The visualisation includes album tracklists, artwork and 30-second previews from the iTunes Search API, collaborator photos and bios from Wikipedia's API.
Why. Once I'd worked out the layout on The Odyssey, I wanted to try it on a dataset I'm actually obsessed with.
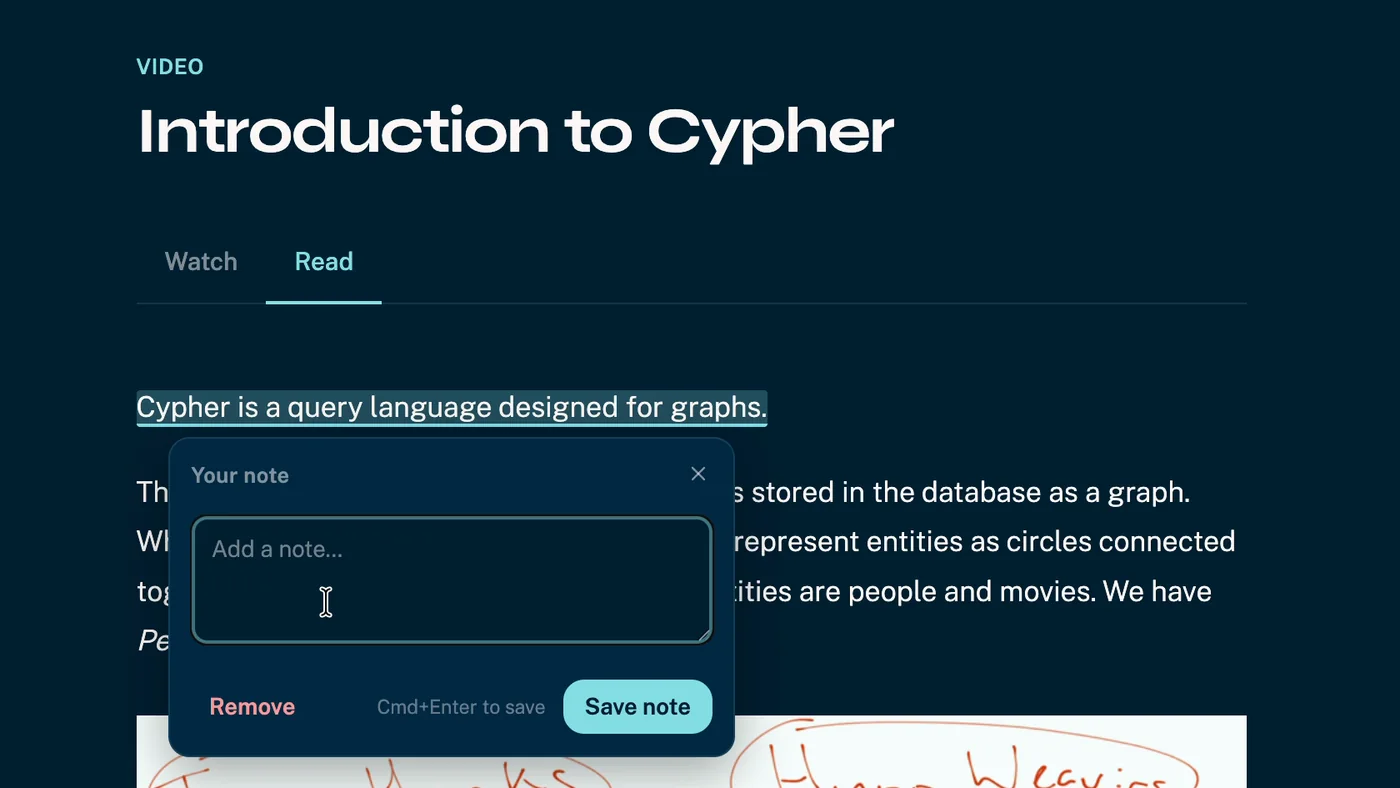
Notes and highlights for GraphAcademy
What. A note-taking feature on Neo4j's free learning platform. Select any text or image in a lesson, highlight it, add a note, and everything you save collects on a "Your notes" page at the end of the course.
How and why
How. I built it in React and TypeScript inside the platform's codebase. The hard parts were anchoring a highlight to text that can change between site rebuilds, and making a save feel instant even when the network isn't.
Why. I wanted learners to be able to keep what they'd found useful without leaving the lesson to do it.
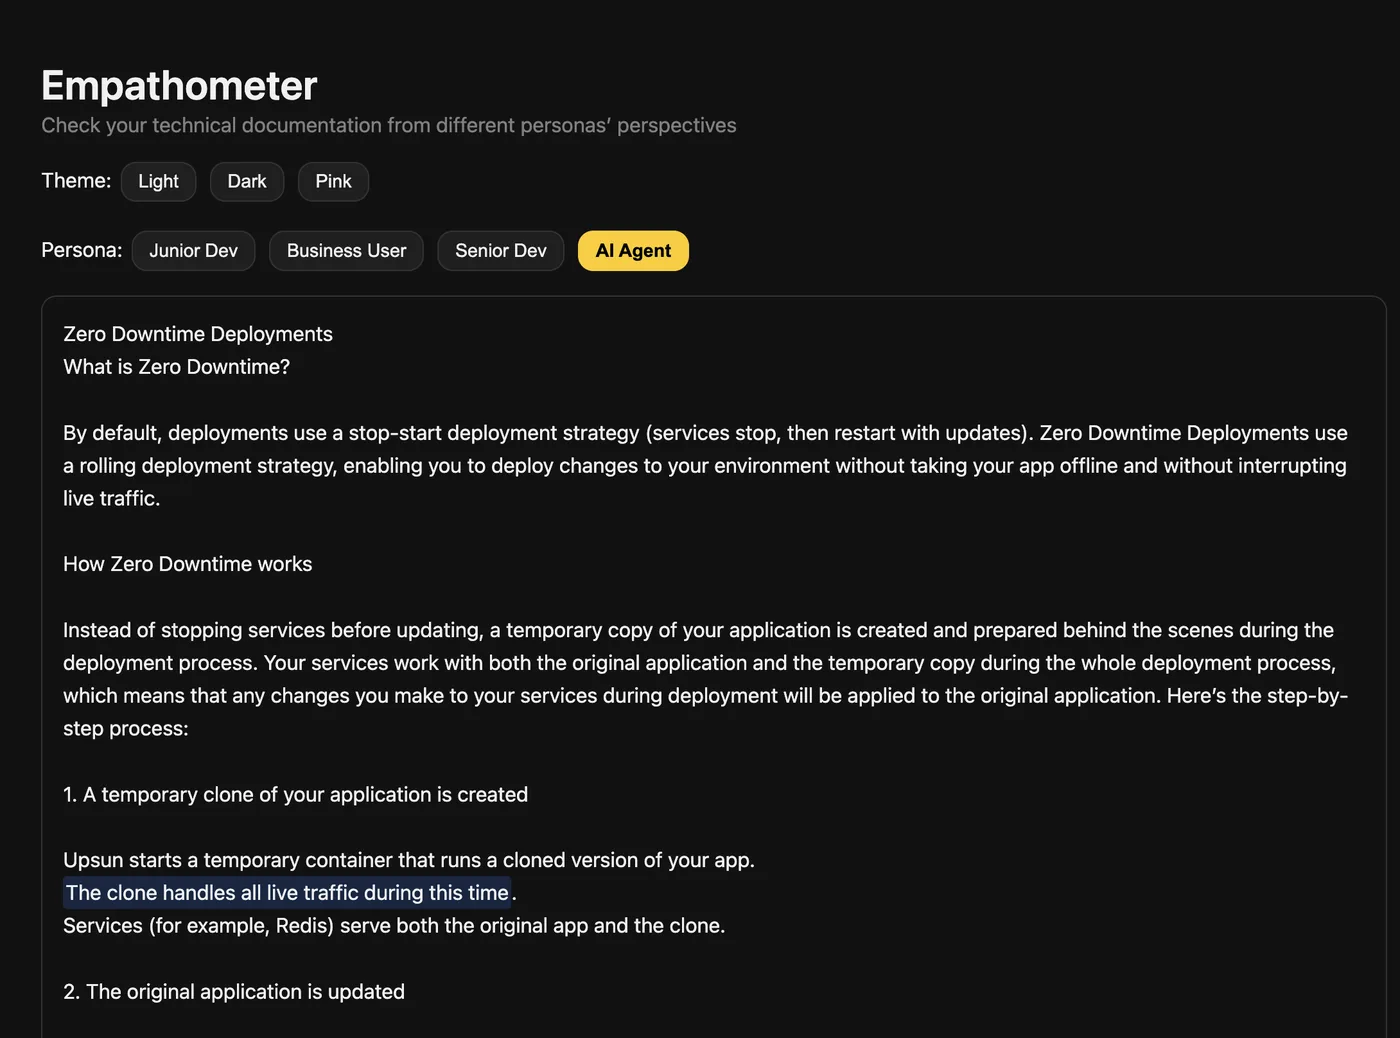
Empathometer
What. A documentation review tool that reads a page as different readers would: junior developer, business user, senior developer, AI agent. Pick a persona and it tells you where that reader gets stuck.
How and why
How. Python and FastAPI, plain HTML, CSS and JavaScript, with the OpenAI API doing the reading. Each persona is a prompt with a point of view, not a checklist.
Why. I built it to help technical writers produce documentation that doesn't assume a particular level of understanding, by showing them how a page reads to someone who isn't them.
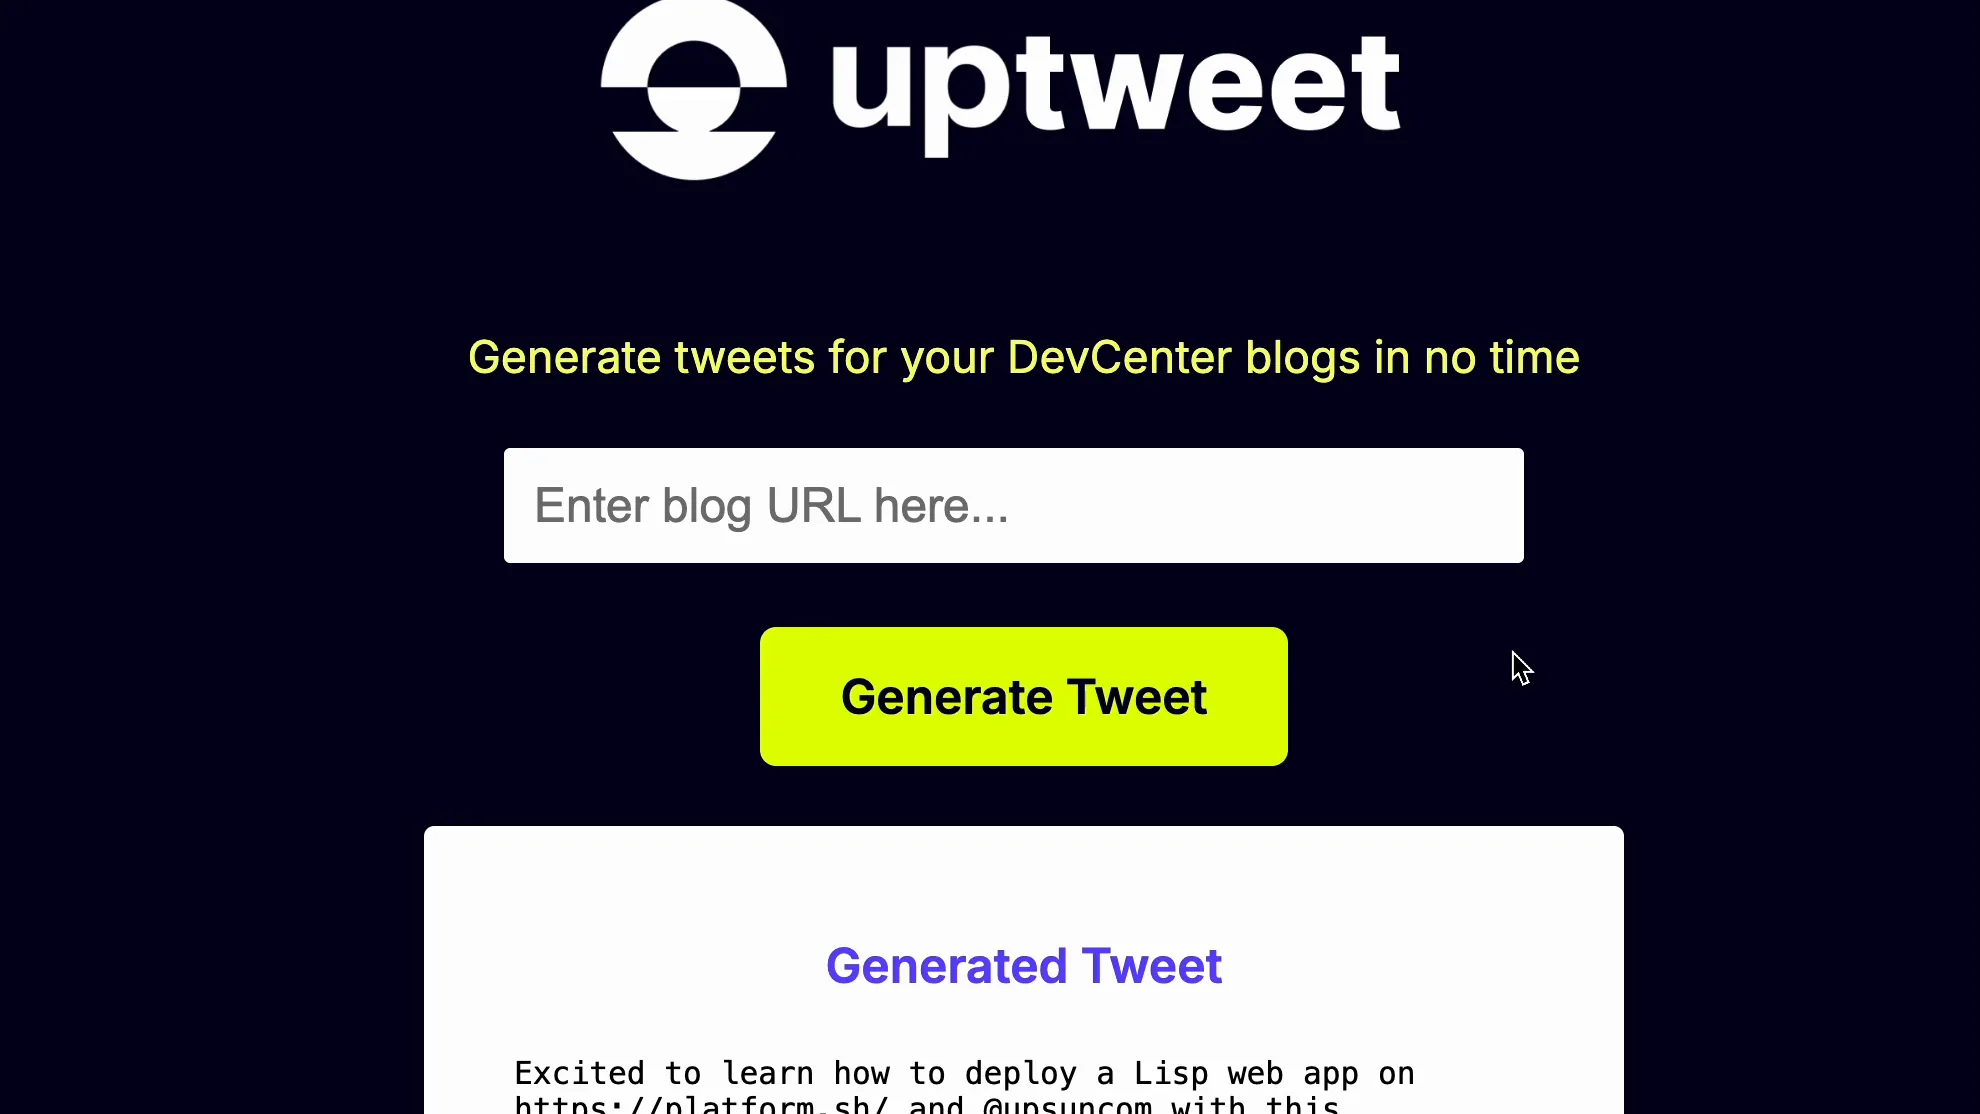
uptweet
What. A small web app that turns a developer blog post into short social posts, and shows its reasoning so you can correct it rather than just accept it.
How and why
How. Python and Flask, with an LLM doing the first draft and a person keeping the voice.
Why. I was on a team of developer advocates who were publishing blog posts every week but didn't have time to write the social copy to promote them, so I built this to help.
Writing
Writing.
A round-up of pieces I've worked on, from data and AI writing to technical documentation and earlier journalism. Some have been updated by their publishers since I wrote them, so they may differ from the originals.
Nightingale · Data Visualization Society · August 2026
The Plot Hole Only a Graph Could Find
I mapped The Odyssey and its two newest adaptations as a network and found a missing connection that weeks of reading the same data in a spreadsheet had hidden.
GraphAcademy blog · September 2026
From Database to Interactive Visualisation: Modelling Data for d3.js
The full write-up of how the Odyssey visualisation was built: the four data modelling decisions that made it possible.
Data and AI
Documentation
- GraphQL Content Delivery overview
- Asset Management API
- Webhook guides
- CLI tool
- The Upsun MCP server
- Build and deploy, including zero-downtime deployments
- FrankenPHP
- Troubleshooting 502 errors
- Up(sun) and running with Lisp
A selection. At Upsun I led the documentation through the Platform.sh brand merge and a replatform to Mintlify; at Amplience I owned the REST and GraphQL API docs.
Earlier journalism, 2016 to 2018
- Moonlight: can Barry Jenkins's coming-of-age tale secure an Oscar?
- The inescapable rise of 3D-printed clothing
- Genius behind the gems: meet Julien Riad Sahyoun
- Thanos, Pennywise and six unlikely film villains
- How to see the world's most impressive natural phenomena in style
- Horror films with killer animal attacks
Education
Education.
Two Master's degrees and a BA, 2011 to 2021, and what each one covered.

MSc Data Science
Birkbeck, University of London · 2019 to 2021 · part-time, alongside full-time work
Python, R and Java. Statistics, machine learning and natural language processing. Data management and SQL. A supervised research project to finish.
MA Contemporary Literature & Cultural Theory
Birkbeck, University of London · 2014 to 2016 · part-time
Twenty-first-century literature and critical theory: how narrative form changes with technology, and how culture is read and argued about. Research essays and a 15,000-word dissertation.

BA English with Creative Writing
University of Nottingham · 2011 to 2014
Two-thirds literature and language, Old English to contemporary, with linguistics. One-third creative writing in workshops: fiction, poetry, structure and editing.
About
About.
I started as a journalist, writing for national newspapers like The Mirror UK, then marketing and data journalism work at Mumsnet and Finder, data visualisation engineering at a media agency, and then I was writing API documentation and doing developer advocacy from then onwards.
At Neo4j I write and film courses for GraphAcademy to teach people how to use graph data, build features on the learning platform, and attend meetups and conferences. Outside work I build things like the projects above, mostly out of curiosity. Based just outside London.
- 2026 to now
Technical Curriculum Developer
Neo4j, GraphAcademy - 2024 to 2026
Senior Technical Writer & Developer Advocate
Upsun (formerly Platform.sh) - 2022 to 2024
Technical Writer, REST and GraphQL APIs
Amplience - 2022
Data Visualisation Engineer
PHD Media - 2020 to 2022
Content Marketing & Data Manager
Finder UK - 2018 to 2020
Commercial Content Creator, then Email Marketing Specialist
Mumsnet - 2016 to 2018
Journalist
The Mirror, The Week UK, Grazia UK